Asymmetric Sparkbars
I am creating some sparkbars, sparkline’s poorer cousin, for a project I’ll talk about soon, and I wanted to represent in a single chart both additions and subtractions.
As it happens, there’s an entire range of Unicode characters devoted to blocks: U+2580 to U+259F, of which U+2581, “Lower one eighth block”, through U+2588, “Full block”, seem perfect for rendering text sparklines.
The smart way to handle this task would’ve been to use jQuery.sparkline, which makes use of the canvas element to draw some pretty impressive charts, but I stubbornly decided to stick with text.
I am starting with two data sets, one representing tasks completed per day - progress, the other
being tasks created per day, for the same interval, and I will use a spark() function provided
by node-textspark to convert each set into discrete values,
returned to me as Unicode characters.
My starting point is these two sparklines:
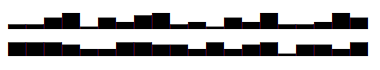
I’d love for the top of the second set to be glued to the bottom of the first set and thus give a good visual of what happened for each day. For that to happen I’ll be using a different color and I will make use of negative space to represent the data points.
First I’ll set the background color of the second series to red and the foreground color to white, effectively transforming the negative space, previously white - now red, into sparkbars that seem to hang from the top.
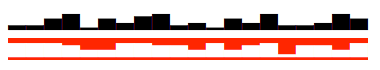
Unfortunately, the block characters stop at the baseline and thus the space between the baseline and the beard line (not making this up) is visible and colored red (from the background).
To make that line go away, I’ll set the height on the div containing the second series
to the same height as the font, then set the overflow property to hidden so that it clips
the bottom part, below the baseline.

Lastly, I’ll set a negative top margin for the second div so that
it gets closer to top series:

I chose to leave a pixel between the series as I think it looks just a tad better than if they had no space between them:

The ending HTML is deceptively simple and scales well when the browser zooms in.
<!DOCTYPE html>
<html>
	<head>
		<style type="text/css">
			.inverse .inner { background-color: red; color: white; }
			.sparkline-group { font: 'Courier New'; font-size: 18px; }
			.sparkline-group .sparkline.inverse {
				margin-top: -7px;
				height: 18px;
				overflow: hidden;
			}
		</style>
	</head>
	<body>
		<div class="sparkline-group">
			<div class="sparkline"><span id="spark1" class="inner"></span></div>
			<div class="sparkline inverse"><span id="spark2" class="inner"></span></div>
		</div>

		<script src="spark.js" type="text/javascript"></script>
		<script type="text/javascript">
			var spark1 = [1,2,5,9,0, 5,4,8,9,1, 3,0,6,4,9, 1,2,3,9,5],
				spark2 = [9,9,8,7,5, 4,8,9,6,6, 4,9,4,7,9, 1,6,7,4,9];
			document.getElementById('spark1').innerHTML = spark(spark1);
			document.getElementById('spark2').innerText = spark(spark2);
		</script>
	</body>
</html>
That’s it.